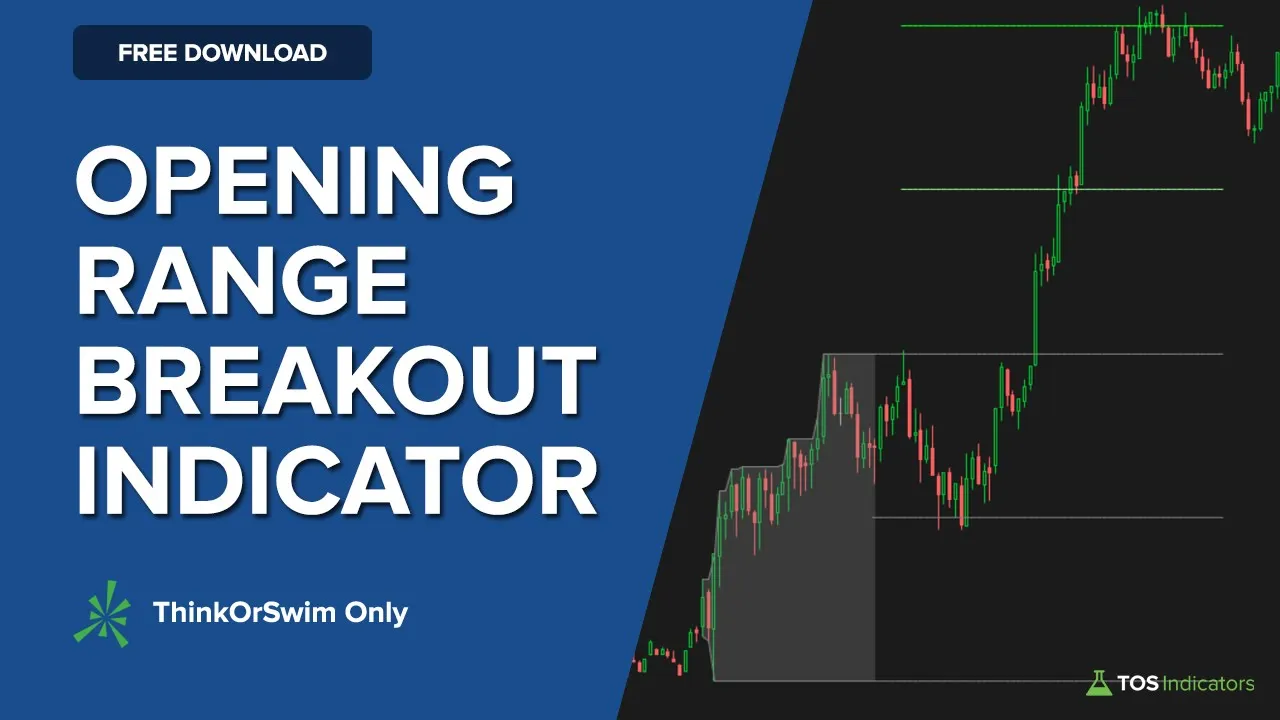
Build an Opening Range Breakout Indicator for ThinkOrSwim in 36 Minutes
Education

Introduction
In this tutorial, we will build a custom Opening Range Breakout (ORB) indicator using ThinkScript on the ThinkOrSwim platform. The final indicator will feature some enhancements to standard ORB setups, making it adjustable and more effective. We'll break down the process into easy-to-understand steps while simultaneously coding the script.
Understanding the Opening Range Breakout
The Opening Range Breakout (ORB) is a trading strategy that seeks to identify a market's trend based on the price movement in the first 30 minutes after the market opens. In our example, we'll use a time frame of 9:30 AM to 10:00 AM Eastern Time. During this period, we'll measure the lowest low and highest high to create two important levels:
- Opening Range Breakout High
- Opening Range Breakout Low
These two levels will help traders determine where price breaks in either direction, indicating potential trading opportunities.
Key Requirements for the ORB Indicator
To create the ORB indicator, we will meet a set of requirements:
Adjustable Opening Range Time: Allow users to set their preferred time frame for the opening range (e.g., 9:30 - 10:00).
Bullish and Bearish ORB Entries: Enable users to plot potential entries based on breakouts and provide calculation for projection levels.
Visual Representations: Only show projection levels after breakouts occur to avoid cluttering the charts.
Alerts for Pullbacks: Optionally add alerts for pullback actions.
Planning the Indicator
Before we start coding, let's outline our approach:
Define the Opening Range: This should be dynamic, allowing user control as described.
Track Highs and Lows: Control for the maximum and minimum prices hit during the opening range.
Create Trade Entry Time Frame: Identify the period where we’ll take trades based on breakouts.
Input for Entry Types: Allow users to choose between "wick touch" or "close above" for breakout definitions.
Plot Lines Strategically: Ensure that when breakouts happen, we only visualize the relevant lines.
Writing the Code
Now, let's get into coding!
We will create the indicator using the
ThinkScriptwithin ThinkOrSwim. Start by naming the script.input opening_range_start_time = 0930; input opening_range_end_time = 1000;Next, define the opening range and draw the relevant highs and lows.
def opening_range = if secondsTillTime(opening_range_start_time) < 0 and secondsTillTime(opening_range_end_time) >= 0 then 1 else 0;Implement the conditions that set up bullish and bearish entry conditions based on user preferences.
switch entry_type (
    case "wick touch":
        bull_entry_condition = OpeningRangeHigh > high[1];
        bear_entry_condition = OpeningRangeLow < low[1];
    case "close above":
        bull_entry_condition = close > OpeningRangeHigh and close[1] < OpeningRangeHigh;
        bear_entry_condition = close < OpeningRangeLow and close[1] > OpeningRangeLow;
)
Plot the relevant visualization elements, like highs, lows, and projections.
plot Opening_Range_High = if opening_range then OpeningRangeHigh else double.nan;
plot Opening_Range_Low = if opening_range then OpeningRangeLow else double.nan;
plot Halfway_Upside_Projection = OpeningRangeHigh + (OpeningRangeHigh - OpeningRangeLow) / 2;
Final Adjustments
Test the implementation to ensure all features such as alerts and projections are functioning correctly. Customize colors and line styles to your preference.
Once everything operates smoothly, you will have a powerful ORB indicator that can enhance your trading strategy.
Keyword
- Opening Range Breakout
- ThinkOrSwim
- ThinkScript
- Trading Strategy
- Dynamic Time Range
- Custom Indicator
- Bullish and Bearish Entries
- Projections
FAQ
Q1: What is an Opening Range Breakout (ORB)?
A1: An ORB is a trading strategy that utilizes the price movements in the market's opening period to identify potential breakout opportunities.
Q2: Why is the ORB indicator customizable?
A2: Customizability allows traders to adapt the indicator to their trading style and preferences, such as changing the time frame or choosing breakout conditions.
Q3: Can the ORB indicator be used for markets other than stocks?
A3: Yes, the ORB indicator can be applied to various markets, including futures and forex, making it a versatile tool for different traders.
Q4: Is it difficult to set up this indicator?
A4: The setup involves basic coding skills in ThinkScript, but the tutorial provided walks through the process step-by-step to make it manageable.
Q5: What are the benefits of using projections in ORB?
A5: Projections offer forecast areas based on historical price movement, helping traders identify potential target prices and better plan their trades.