Relative Volume RVOL Custom Script for ThinkorSwim
Education

Relative Volume RVOL Custom Script for ThinkorSwim
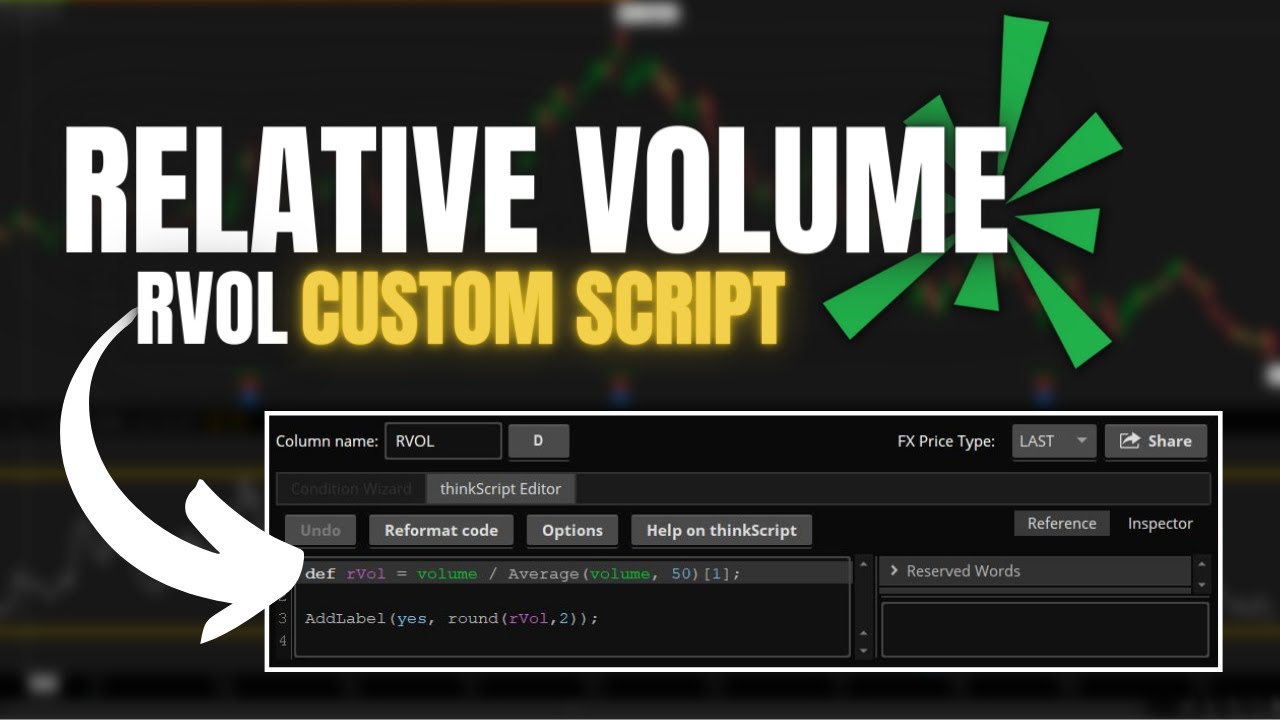
Relative Volume, often referred to as RVOL (or Arvol), is an essential indicator in trading that compares the current trading volume of a stock to its average volume over a given period. Displayed as a ratio, this indicator helps traders swiftly determine how active a stock is trading today compared to its average. This article will guide you through calculating RVOL, loading a custom script in ThinkorSwim to view it, and understanding how it can be implemented into your trading strategies.
Calculating Relative Volume
The calculation of RVOL is straightforward: [ \text(Relative Volume (RVOL)) = \frac(\text{Current Volume)}(\text{Average Volume over Selected Period)} ]
For our indicator, we’ll use the average trading volume over the past 50 days. For example, if XYZ stock has an average trading volume of 1 million shares over the past 50 days and today's volume is 1.5 million shares, the RVOL is: [ \text(RVOL) = \frac(1.5 \text{ million)}(1 \text{ million)} = 1.5 ]
This indicates that today's trading volume is one and a half times the average. An RVOL value of 1 signifies that the current volume is on par with the average, values greater than 1 indicate higher than average volume, and values less than 1 indicate lower than average volume.
Adding the Script to ThinkorSwim
To visualize RVOL on the ThinkorSwim platform, follow these steps:
- Obtain the Script: You can copy the script from the pinned comment below the video or article.
- Open ThinkorSwim: Navigate to the Watchlist section on the left-hand side of the platform.
- Access Settings: Click on the gear icon in the top right corner of the Watchlist.
- Customize: Select "Customize" to open the customization window for adding new columns.
- Select Custom Column: Choose an unused custom column, such as 'Custom 1.'
- Edit Script: Click the script icon next to the custom column name, delete the existing script (e.g., simple moving average), and paste the copied RVOL script into the ThinkScript Editor. Rename this column to 'Arvol' or 'RVOL.'
- Apply and Save: Click “OK” to save the changes, and add this new custom column to your Watchlist.
- Sort by RVOL: You can sort the column by clicking on it to see which stocks have the highest or lowest relative volume.
Practical Application of RVOL
Upon successfully adding the RVOL script to your Watchlist, you can quickly determine the trading activity relative to its average. For instance:
- High RVOL means strong trader commitment to the price movement, indicating potential trends.
- Low RVOL might suggest a lack of commitment, possibly hinting at a reversal or a new trading range.
Analyzing RVOL helps gauge if a price move has staying power. For instance, a low-volume pullback might just be temporary, whereas a high-volume pullback could signal a more significant downtrend.
Keywords
- Relative Volume
- RVOL
- ThinkorSwim
- Trading Indicator
- Volume Analysis
- Custom Script
- Stock Activity
FAQ
Q1: What is Relative Volume (RVOL)? Relative Volume (RVOL) is an indicator comparing the current trading volume to the average volume over a specified period, helping traders assess stock activity and potential trends.
Q2: How do you calculate RVOL? RVOL is calculated by dividing the current volume by the average volume over the selected period. For example, if the current volume is 1.5 million and the average volume is 1 million, the RVOL would be 1.5.
Q3: How can I add the RVOL script to ThinkorSwim? Follow these steps: Obtain the script, open ThinkorSwim, access settings in the Watchlist, select a custom column, paste the script in the ThinkScript Editor, rename the column, and save the changes.
Q4: How do I interpret high and low RVOL values? High RVOL indicates strong trader commitment and potential trend continuation, while low RVOL suggests a lack of commitment, hinting at possible reversals or new trading ranges.
Q5: Can I sort stocks by RVOL on ThinkorSwim? Yes, after adding the RVOL custom column, you can sort stocks by RVOL to identify the most and least active stocks relative to their average trading volume.